

Time Travel: Isochronic Charts Map Far-Out Journeys
Share
APEX Insight: The time it takes to go the distance sure isn’t what it used to be.
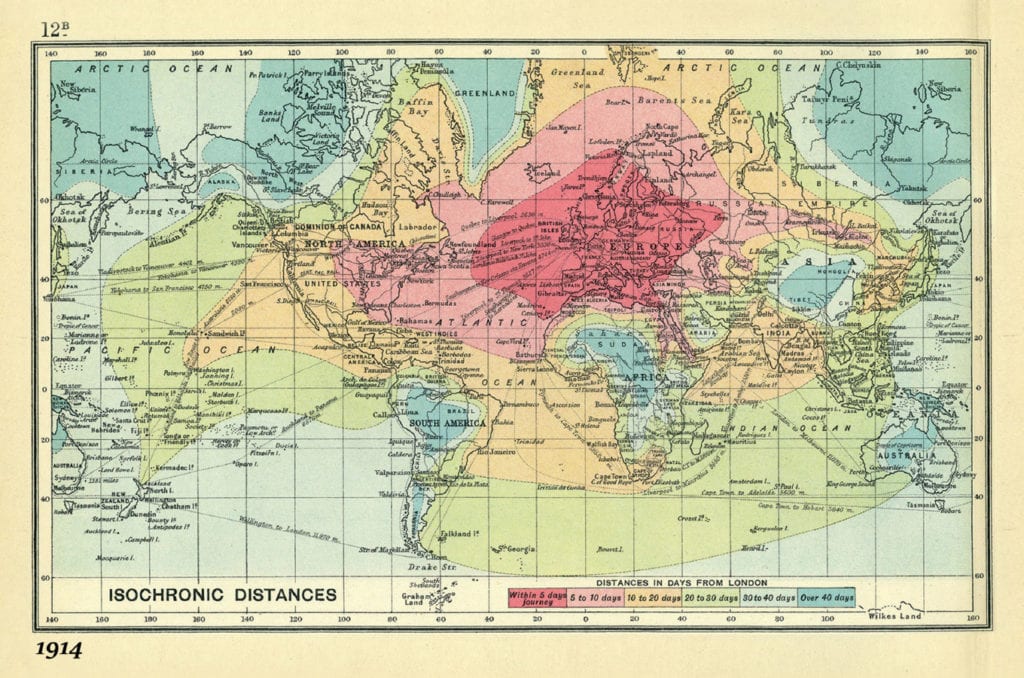
While most passengers groan over airline journeys in excess of 24 hours – with multiple legs and layovers at different airport hubs – the time it takes to travel now isn’t what it used to be. In 1881, it would have taken 30 to 40 days to travel from London to Singapore, at least, that is, according to one of the first isochronic maps created by British explorer and cartographer Francis Galton.
With London as his starting point, Galton plotted out the travel distances between locations around the world and colored them into zones. At a glance, you could look at a map and measure how far you could travel within different blocks of time.

Commercial air travel has made the world much smaller. Thirty-seven years ago, when APEX was founded as the World Airline Entertainment Association in 1979, it would have taken approximately 17 hours in the air for travelers to reach London from Singapore on jumbo jets – a travel time that was almost cut in half after a few years when British Airways and Singapore Airlines operated the Concorde in a joint service.
Even without commercial supersonic flights, improved long-haul operations are reducing travel times. Singapore Airlines is set to reclaim the crown for world’s longest flight with its Singapore-New York City route, which was the longest in the world from 2004 until it was discontinued in 2013. Scheduled to relaunch in 2018, it promises to bring passengers halfway around the world in around 19 hours, very different from the length of time it would have taken to travel multiple legs between the two cities in the 1970s, let alone the 1880s.
Looking ahead, flights from London may be able to reach Singapore in less time than it takes to fly across North America. British aerospace technology firm Reaction Engines is currently working on a new engine system called Sabre that will fly anywhere in the world in four hours or less.
“Time Travel” was originally published in the October/November issue of APEX Experience magazine.
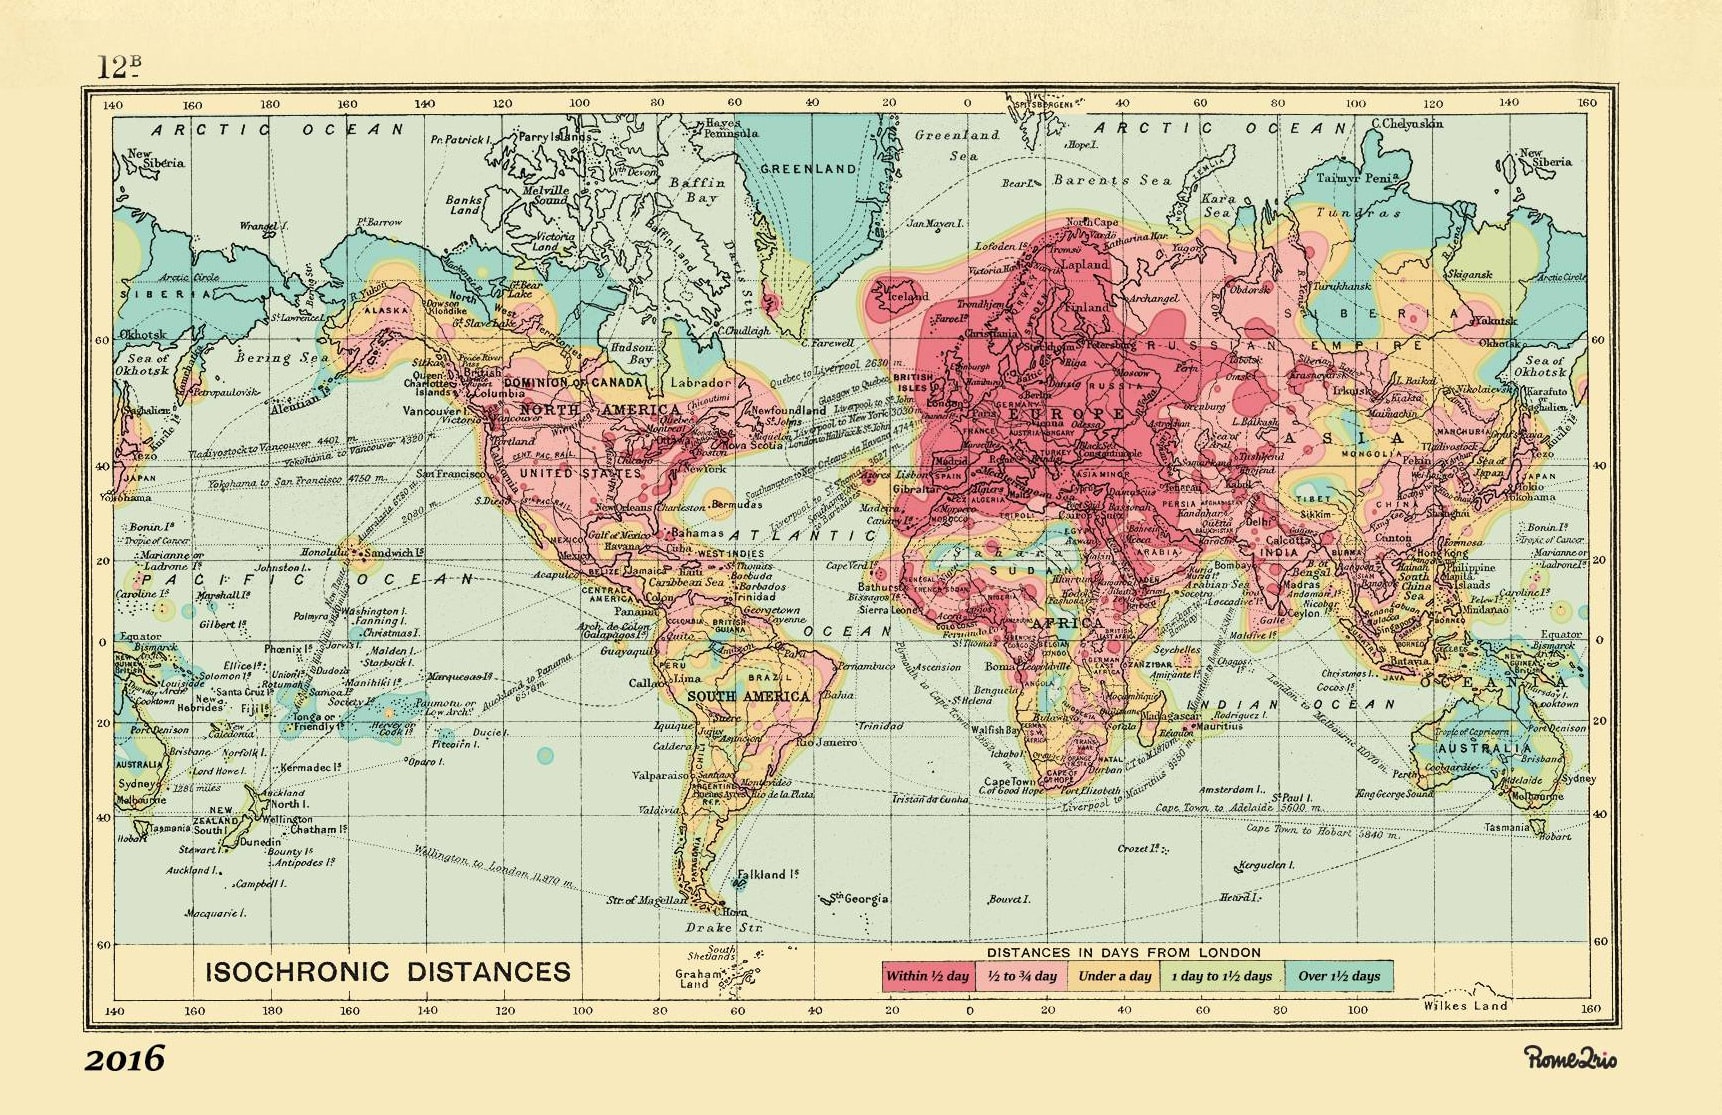
Online Exclusive: APEX Media spoke with Andrew Greig, senior software developer at Rome2Rio, about the search engine’s modern-day isochronic map.
How long did it take to create the 2016 version of Bartholomew’s 1914 isochronic map?
The initial data crunching to process the travel took several hours to generate the travel times between London and every major airport in the world. The 2016 version of the isochronic map was first generated by Rome2rio’s own internal routing engine. It started in London and then calculated the travel time to every major airport in the world, including connections and transfer times. This process took around 5 hours to run and the output was a very rough and pixelated version of the isochronic map. We then took this rough map and recreated it in Photoshop. This was all done by hand and carefully crafted over the space of about 3-4 days to make sure all the detail and points of interest were captured.
What was the most interesting part of the process?
The most interesting thing we learned was probably just how much flight travel has opened up the entire world to us. Before commercial flight was readily available, all long-distance travel was done over land by train or across the oceans by boat. The 2016 isochronic map showed us how the strategic placement of an airport could completely change how quickly people can access that part of the world.
How will travel time change in 100 years from now?
Commercial travel across the globe will only get quicker. Currently, you can get to almost any point on the planet in under 48 hours – this could easily be halved as super-sonic travel starts to become commercially viable. Or maybe we won’t see travel times change much at all as the need for quick/instant travel becomes less necessary, as more business and communication is done via the Internet.