How SITA Measures Travel Tech’s “Feel Good” Factor
Share

Global aviation IT provider SITA and Air Transport World (ATW) have released the results of their 10th annual Passenger IT Trends Survey, which, this year, focuses on the emotional response air travelers have to technology improvements along their travel journey.
To help measure passenger satisfaction, SITA’s survey consultants opted to apply Plutchik’s Wheel of Emotions to “explore the connection between a passenger’s use of technology and their emotions to discover how passengers around the world feel at every point of the journey.”
“As passengers become more connected and airports more crowded, the move to providing additional self-service continues,” says Nigel Pickford, director, Market Insight at SITA.”However, at SITA we wanted to get a better understanding of the connection between a passenger’s emotions at different stages of their journey and the technologies that have been used. Our survey shows that not only are passengers willing to use technology throughout their journey, but they have a clear preference to use their own technology when they have the choice.”
Plutchik’s wheel is a proven emotion theory, in place since 1980, which has successfully been applied to several applications in IT, including sentiment analysis for social media monitoring.

“Psychologist Robert Plutchik created the 2-D wheel and a conical 3-D version in 1980 as a tool for understanding his psycho-evolutionary theory of emotion,” Pickford explains. “Plutchik identified eight primary emotions, which he coordinated in pairs of opposites: joy versus sadness, trust versus disgust, fear versus anger and anticipation versus surprise. Intensity of emotion and indicator color increases toward the center of the wheel and decreases outward. At the center, terror, for example, becomes fear and then apprehension; ecstasy becomes joy and then serenity. Secondary emotions are displayed as combinations of the primary ones.”
The SITA survey was conducted in the first months of 2015 across 17 countries, representing 76 percent of the world’s passenger traffic.
Key emotional responses to the travel experience revealed in this year’s report include:
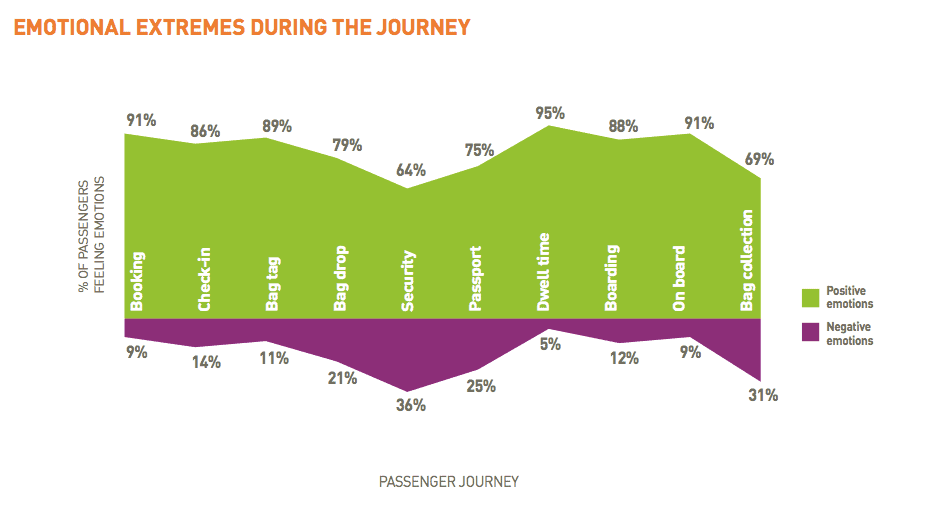
- 91% of respondents experienced positive emotions during the booking phase of their travel.
- 95% of passengers felt the most happy and excited during dwell time, defined as points in the journey when they are able to relax, such as at the terminal before boarding.
- 91% felt happy during dwell times onboard the aircraft.
The chart from SITA below shows the correlation of positive emotions to negative emotions among survey respondents on these key technology touch-points:
Being open to alternative metric methodologies helps aviation companies better understand passengers’ reaction to air travel’s many phases. Perhaps more importantly, it helps airlines, airports and solutions providers visualize data to more effectively humanize and personalize the travel experience.
A similar methodology, focused on the sensory experiences of travelers at various points in the journey was prepared by the Willem de Kooning Academy in Rotterdam as part of a special project which aimed to map human sensory information and focused specifically on air travel.

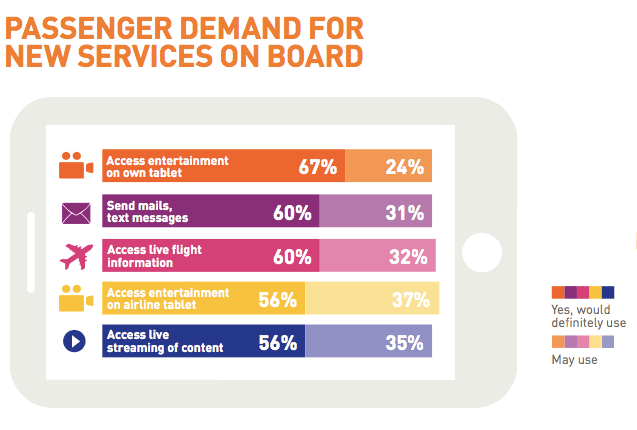
APEX members might also be interested to note the results of SITA’s 2015 survey which show passenger demand for mobile services onboard the aircraft: